Fitxer:Milankovitch Variations.png

El contingut de la pàgina no s'admet en altres llengües.
De la Viquipèdia, l'enciclopèdia lliure

Milankovitch_Variations.png(479 × 363 píxels, mida del fitxer: 32 Ko, tipus MIME: image/png)

Descripció a Commons

Resum

Descripció
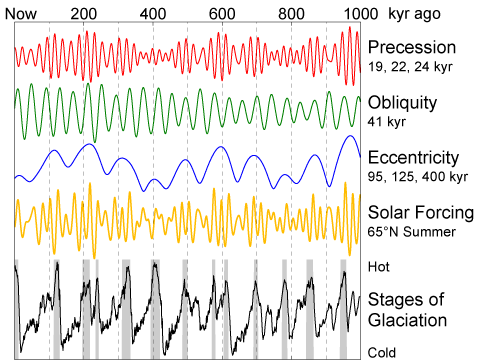
English: This figure shows the variations in Earth's orbit, the resulting changes in solar energy flux at high latitude, and the observed glacial cycles.

According to Milankovitch Theory, the precession of the equinoxes and the apsides, variations in the tilt of the Earth's axis (obliquity) and changes in the eccentricity of the Earth's orbit are responsible for causing the observed 100 kyr cycle in ice ages by varying the amount of sunlight received by the Earth at different times and locations, particularly high northern latitude summer. These changes in the Earth's orbit are the predictable consequence of interactions between the Earth, its moon, and the other planets.

The orbital data shown are from Quinn et al. (1991). Principal frequencies for each of the three kinds of variations are labeled. The solar forcing curve (aka "insolation") is derived from July 1st sunlight at 65 °N latitude according to Jonathan Levine's insolation calculator [1]. The glacial data are from Lisiecki and Raymo (2005) and gray bars indicate interglacial periods, defined here as deviations in the 5 kyr average of at least 0.8 standard deviations above the mean.
Data 11 de febrer de 2006 (upload date)
Font Treball propi
Autor This image was produced by Robert A. Rohde from publicly available data, and is incorporated into the Global Warming Art project.
Altres versions Derivative works of this file:  Variacions de Milankovitch.png

References

  • Lisiecki, L. E., and M. E. Raymo (2005), "A Pliocene-Pleistocene stack of 57 globally distributed benthic δ18O records." Paleoceanography 20, PA1003, doi:10.1029/2004PA001071 (alternative full text link: [2]).
  • Quinn, T. R., S. Tremaine, and M. Duncan (1991), "A Three Million Year Integration of the Earth's Orbit." The Astronomical Journal 101, pp. 2287-2305, doi:10.1086/115850.


Aquesta imatge (de tipus gràfic) s'hauria de tornar a crear utilitzant gràfics vectorials com ara un fitxer SVG. Això té diversos avantatges; en trobareu més informació a Commons:Media for cleanup. Si ja disposeu d'una versió d'aquesta imatge en format SVG, us preguem que la pengeu; després, reemplaceu aquesta plantilla amb la plantilla {{Vector version available|nom nou de la imatge.svg}} en aquesta imatge.

Llicència

Image from Global Warming Art
This image is an original work created for Global Warming Art. Please refer to the image description page for more information.
GNU head S'autoritza la còpia, la distribució i la modificació d'aquest document sota els termes de la llicència de documentació lliure GNU versió 1.2 o qualsevol altra versió posterior que publiqui la Free Software Foundation; sense seccions invariants, ni textos de portada, ni textos de contraportada. S'inclou una còpia d'aquesta llicència en la secció titulada GNU Free Documentation License.
w:ca:Creative Commons
reconeixement compartir igual
Aquest fitxer està subjecte a la llicència de Creative Commons Reconeixement i Compartir Igual 3.0 No adaptada.
Sou lliure de:
  • compartir – copiar, distribuir i comunicar públicament l'obra
  • adaptar – fer-ne obres derivades
Amb les condicions següents:
  • reconeixement – Heu de donar la informació adequada sobre l'autor, proporcionar un enllaç a la llicència i indicar si s'han realitzat canvis. Podeu fer-ho amb qualsevol mitjà raonable, però de cap manera no suggereixi que l'autor us dóna suport o aprova l'ús que en feu.
  • compartir igual – Si modifiqueu, transformeu, o generareu amb el material, haureu de distribuir les vostres contribucions sota una llicència similar o una de compatible com l'original
Aquest avís de llicència s'ha afegit a aquest fitxer d'acord amb l'actualització de la llicència GFDL.

Llegendes

Afegeix una explicació d'una línia del que representa aquest fitxer

Elements representats en aquest fitxer

representa l'entitat

Historial del fitxer

Cliqueu una data/hora per veure el fitxer tal com era aleshores.

Data/horaMiniaturaDimensionsUsuari/aComentari
actual13:35, 11 feb 2006Miniatura per a la versió del 13:35, 11 feb 2006479 × 363 (32 Ko)David Legrand== Description == This figure shows the variations in Earth's orbit, the resulting changes in solar energy flux at high latitude, and the observed glacial cycles. According to Milankovitch Theory, the precession of the [[

La pàgina següent utilitza aquest fitxer:

Ús global del fitxer

Utilització d'aquest fitxer en altres wikis:

Vegeu més usos globals d'aquest fitxer.